Use the dashboard to get a quick summary of recent activity and jump into common workflows.
When To Use This
Use the dashboard when you want a high-level view of recent activity before drilling into detailed accounting pages.
Before You Start
- You have an active company selected.
- The dashboard is available from the sidebar.
Steps
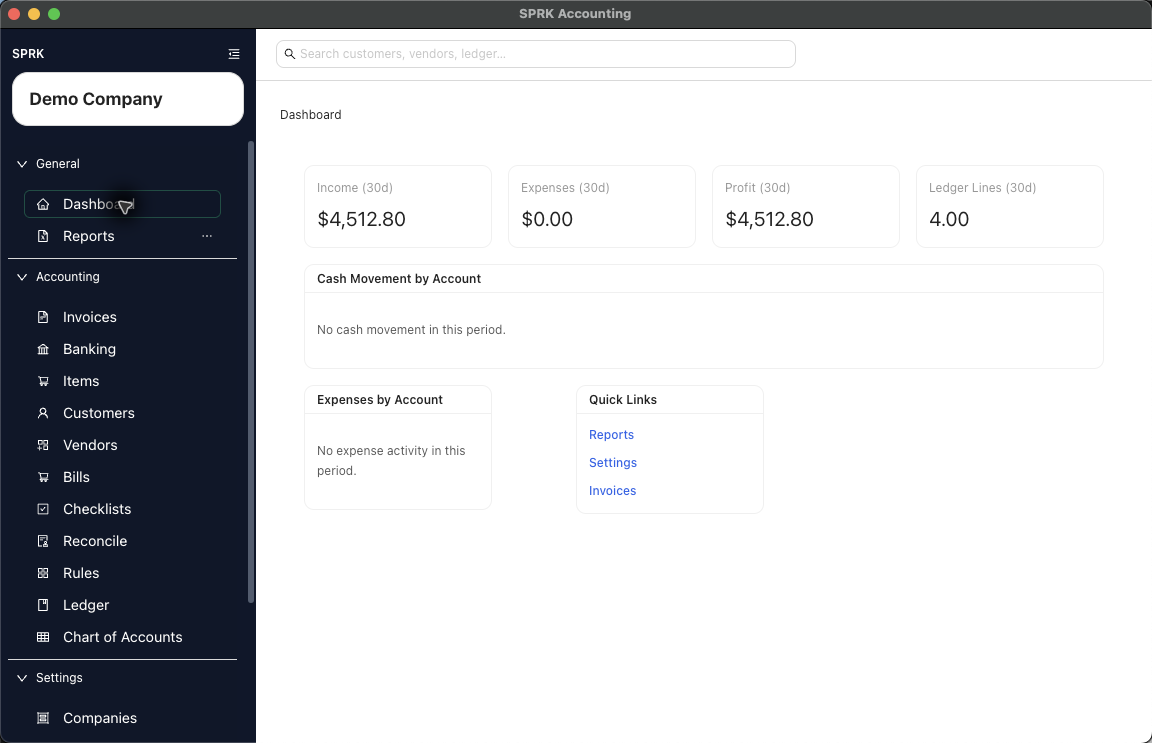
- Select
Dashboardin theGeneralsection of the sidebar. - Review the top KPI cards for the current 30-day snapshot:
Income (30d)Expenses (30d)Profit (30d)Ledger Lines (30d)
- Review the chart panels:
Cash Movement (30d)Expenses by Category (30d)
- Use the
Quick Linkscard when you want to jump directly into one of the linked workflows. - If the dashboard is still loading, wait for the summary cards and charts to populate before using the numbers operationally.
What Happens Next
You can read the dashboard as a summary page and use it as a launch point into deeper workflows.
If Something Looks Wrong
| What You See | What To Check | What To Do Next |
|---|---|---|
| Two similar workflows or fields are easy to mix up | Treating dashboard figures as the place to do detailed investigation | Use the linked working pages when you need record-level detail |
| The result does not match what you expected | Interpreting loading placeholders as final values | Review the visible state and use the related workflow before continuing |
| The result looks ready, but a key check is unresolved | Assuming the quick links list is configurable from the dashboard itself | Use it as navigation, not as a setup panel |